
1
Traditional solar PV
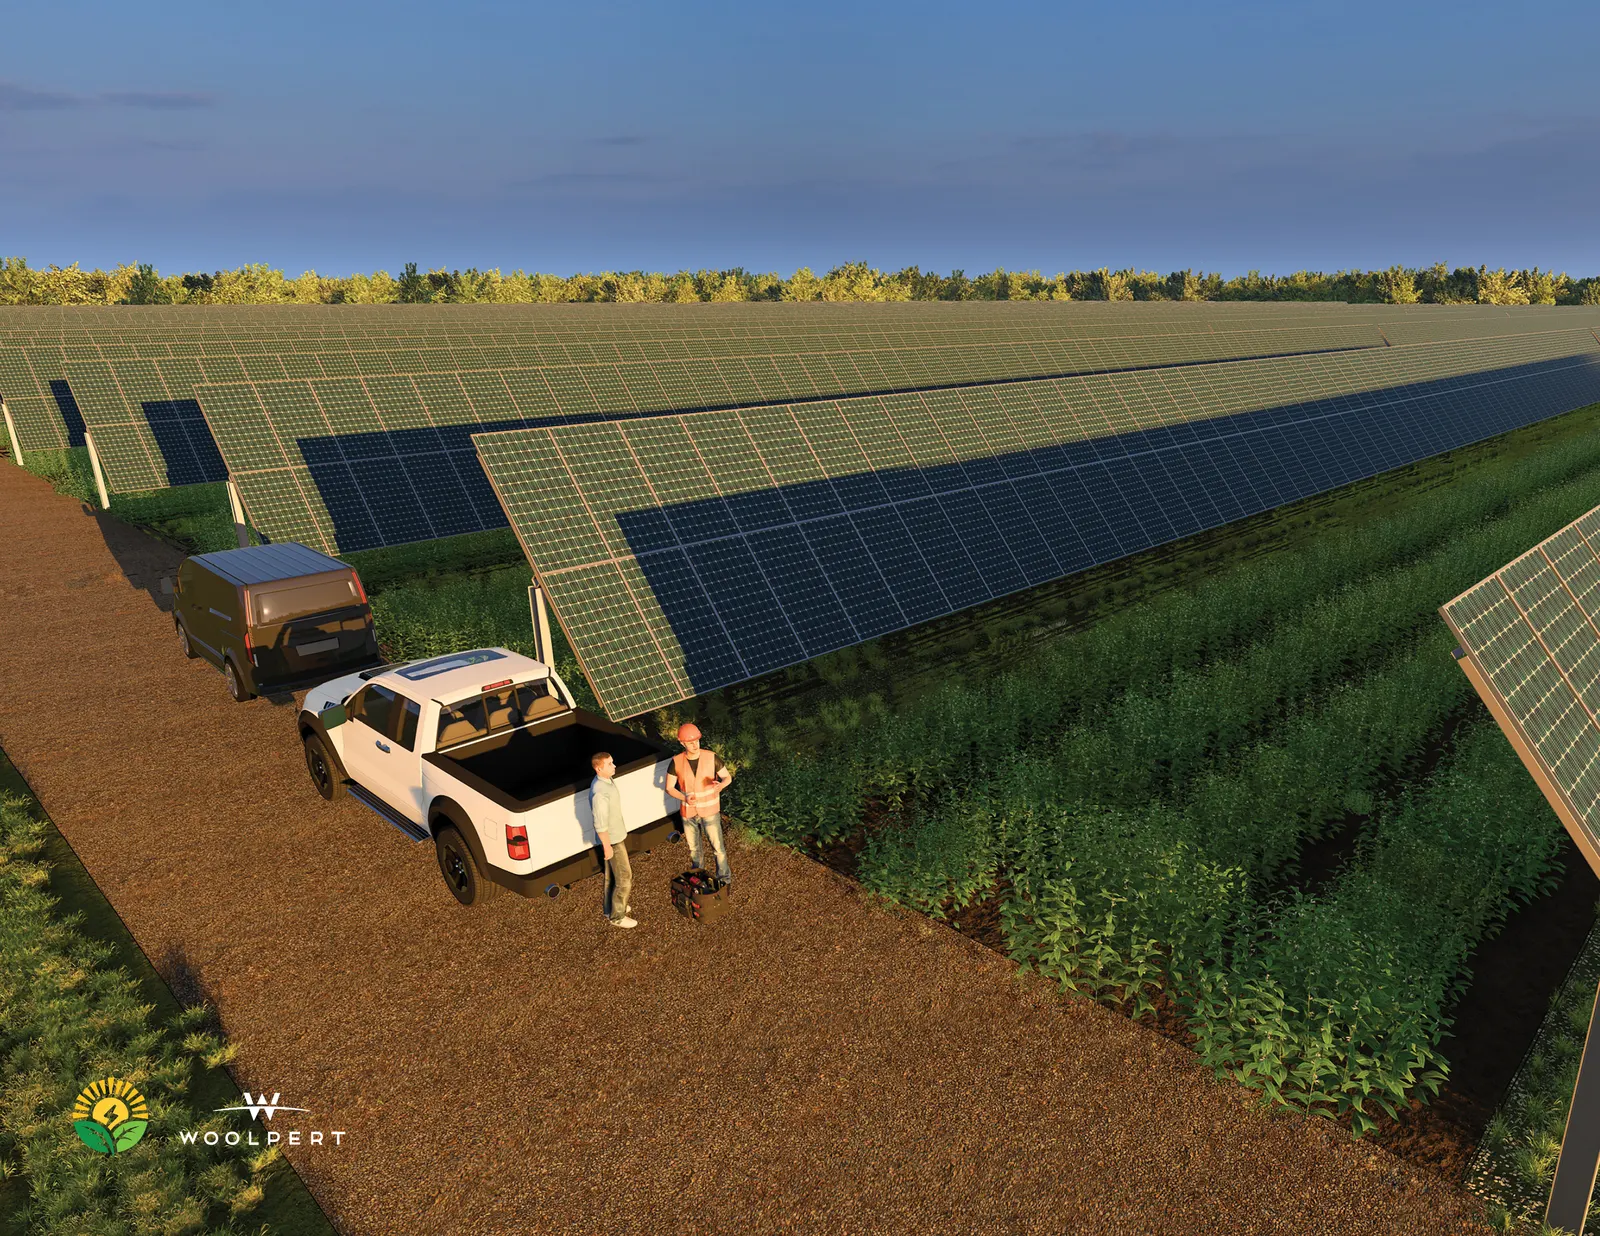
Direct site footprint: approximately 700–890 acres.
Farm productivity on occupied land: typically minimal if ordinary farming stops.
+700 to +890acres lost
A land-equivalent comparison for a 100 MW project on farmland shows how traditional solar, agrivoltaic design, fossil generation footprints, and yield-enhancing Solargation change agricultural productivity.
Net agricultural land-equivalent loss = gross project acres × (1 − retained farm productivity).
Negative values mean the field produces a net farm-output gain compared with baseline agricultural productivity.
The table-style cards below convert each technology into an agricultural land-equivalent impact, using the assumptions in the right-hand panel.
Direct site footprint: approximately 700–890 acres.
Farm productivity on occupied land: typically minimal if ordinary farming stops.
Direct site footprint: approximately 700 acres.
Farm productivity retained: approximately 70%–100% in the illustrative case.
Direct site footprint: approximately 12 acres.
Farm productivity on occupied land: 0%, with additional dispersed upstream oil, refining, and transport land impacts.
Direct site footprint: approximately 11 acres.
Farm productivity on occupied land: 0%, with upstream wells, gathering, pipelines, and compressor-station land impacts.
Direct site footprint: approximately 700 acres at 7 acres per MW.
Farm productivity enhanced: approximately 110%–150% of baseline in the illustrative case.
Fossil technologies can appear land-light at the power-plant site, but they also rely on upstream land for fuel extraction, processing, and transport. Agrivoltaic and Solargation productivity values are illustrative and depend on crop type, design, climate, and farm operations.
The land-use advantage is not only putting panels above crops. It is using the same infrastructure to preserve or improve output through shade, irrigation, microclimate, and data-enabled material dispersal.
Solargation is intended to preserve and improve farm output through dual use, microclimate support, water efficiency, irrigation integration, and data-driven material dispersal.
Sources noted in the provided land-use graphic: NREL utility-scale PV land use; Jacobson / Stanford land-footprint compilation for fossil power plants; recent agrivoltaic review reporting land-use efficiency gains up to 200%; University of Arizona / Barron-Gafford agrivoltaic field results showing higher yields for some crops and lower transpiration.
This land-use page is structured as a responsive HTML5 website that preserves the prior Solargation visual system while explaining the agricultural land-equivalent comparison in a clearer, web-ready format.
Back to top